Variance Analysis: Explaining Every Number, Not Just Reporting It
Last updated: August 6, 2026
A budget-vs-actual table is easy to produce — most accounting systems will spit one out in two clicks. The hard part, the part that actually takes hours, is the column next to it: the explanation. Why was S&M $70K over budget? Why did SMB revenue miss by 1.3% when Enterprise beat by double digits? A board doesn't just want the number, it wants the reason, and it wants it for every line that moved enough to matter.
That's usually the most time-consuming part of building a board report, because it can't be templated the way the table itself can. Every month the story is different.
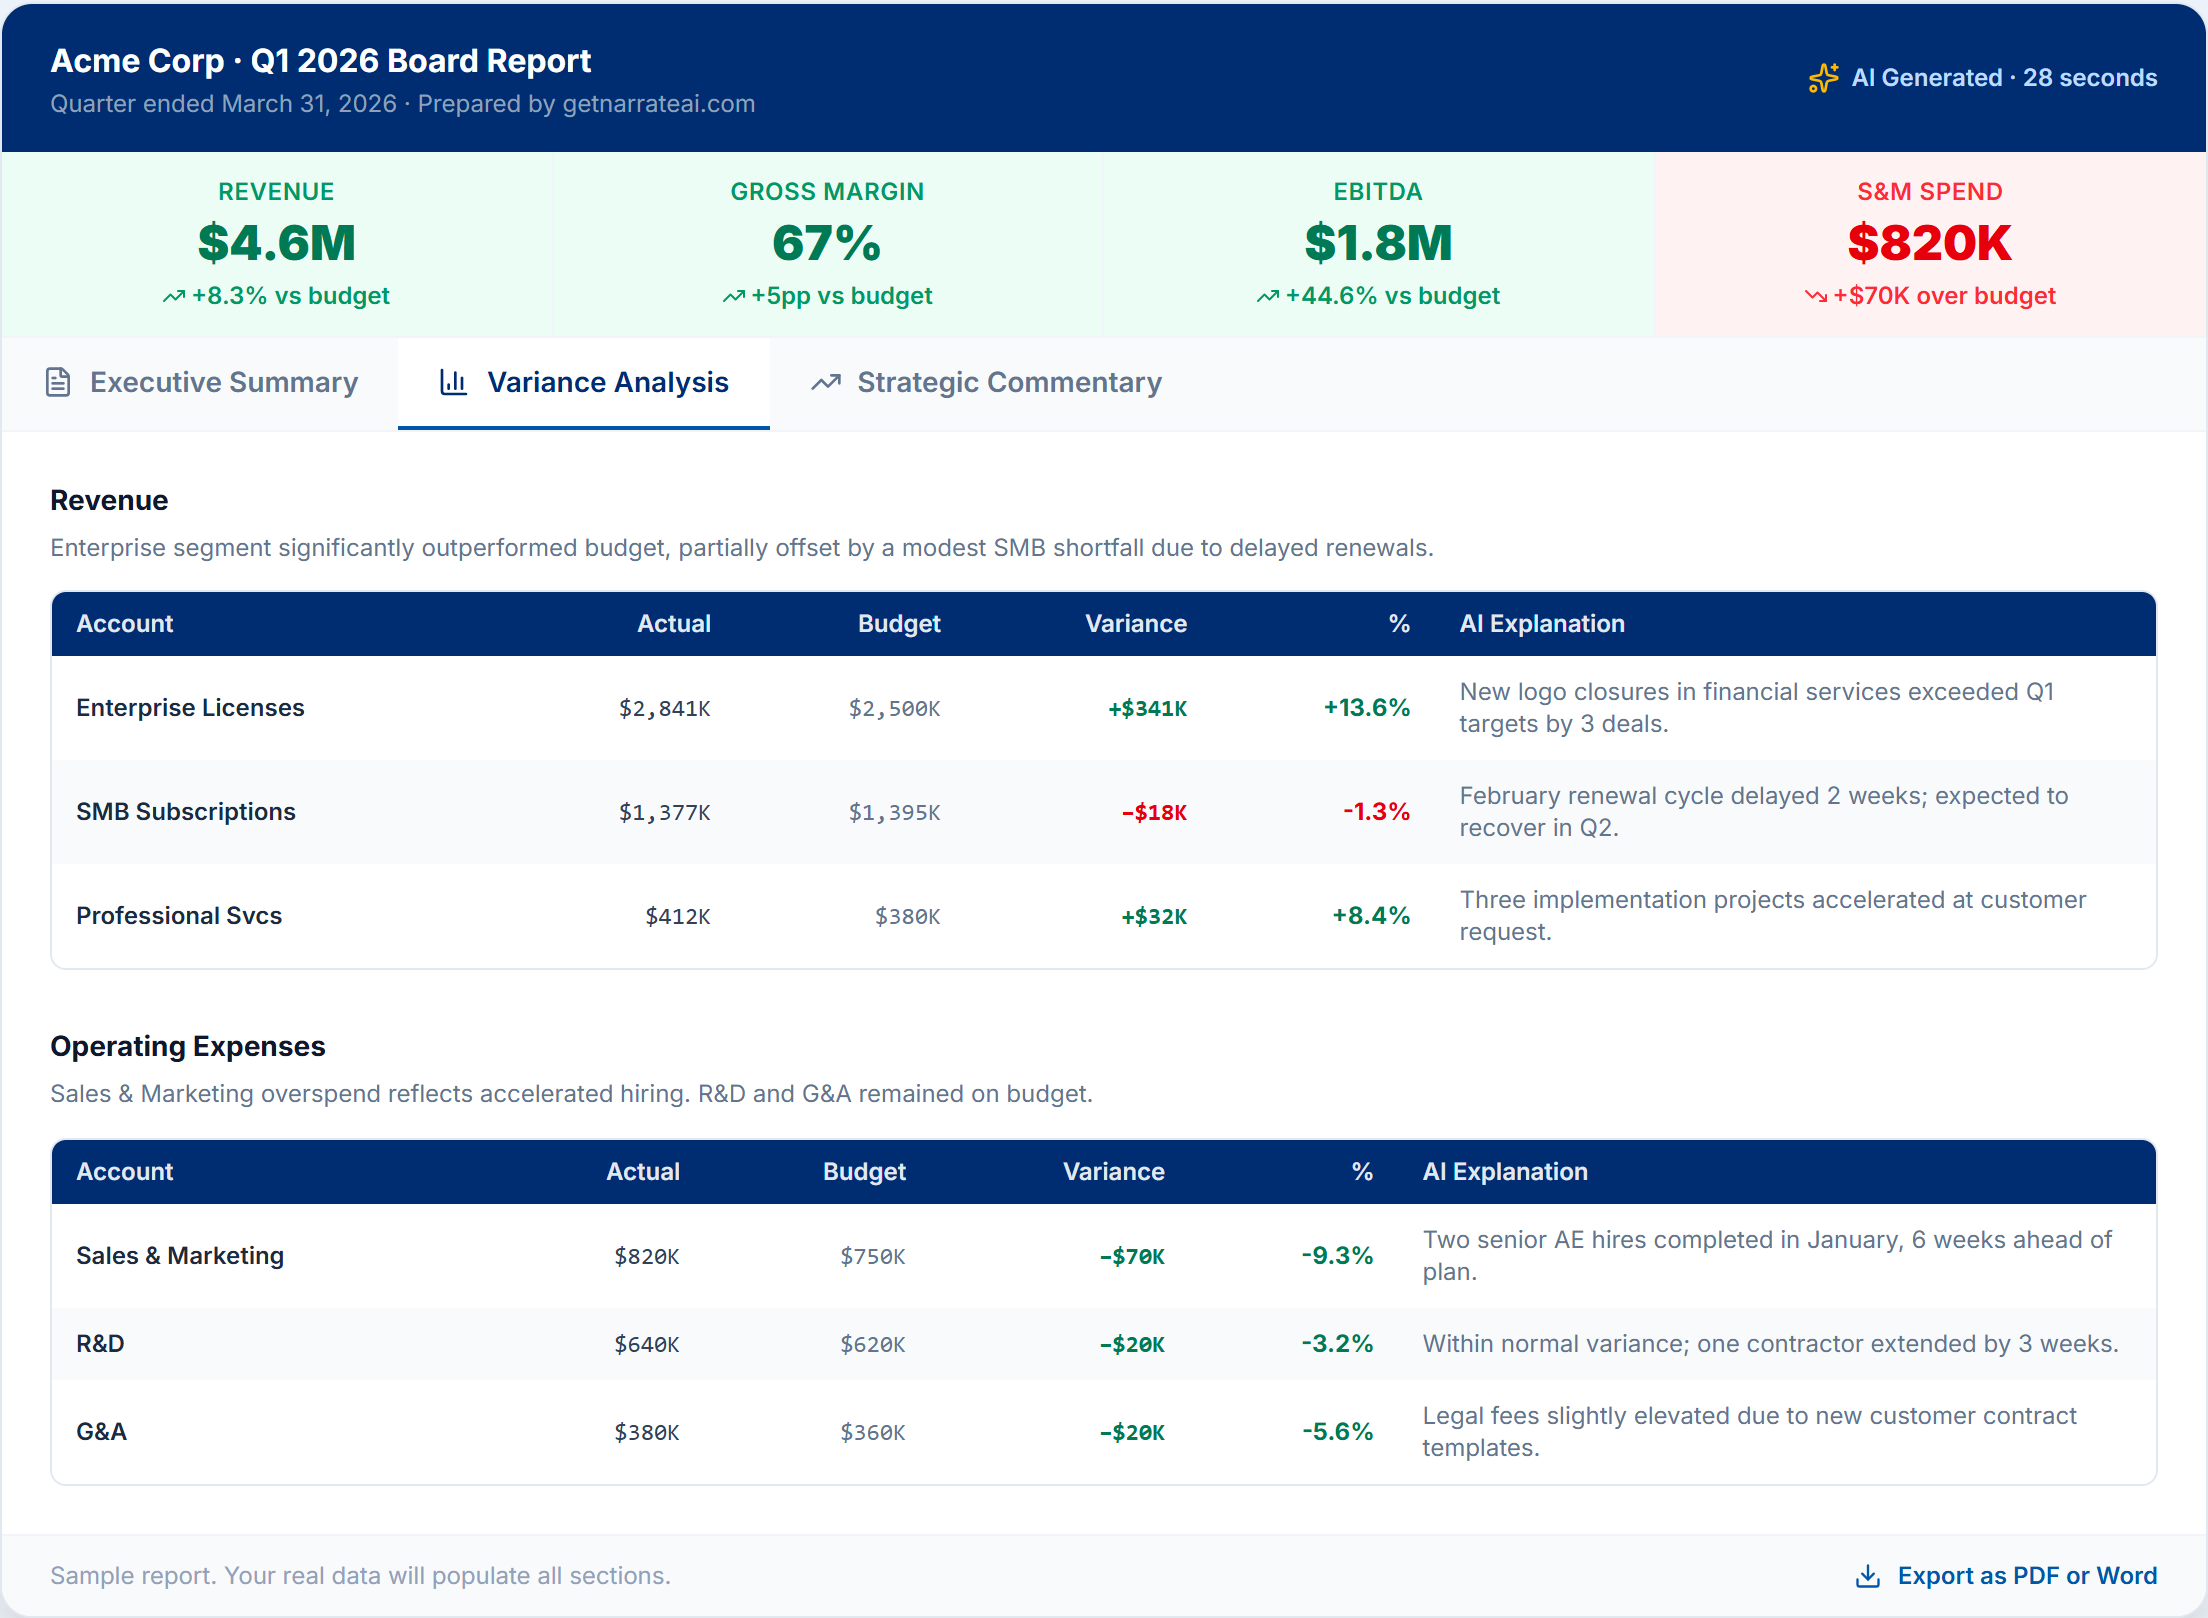
Line-by-line variance explanations, grouped by category, on a real getnarrateai report.
What good variance commentary looks like
Good variance analysis doesn't explain every line — it explains the lines worth explaining, and it does so with actual context, not restated math. "Revenue exceeded budget by $323K, driven by three enterprise deals closing ahead of schedule" is useful. "Revenue was up 8.3%" is just the number you already had.
How getnarrateai handles it
getnarrateai generates line-by-line variance explanations for Revenue, COGS, OpEx, and EBITDA, comparing actuals against budget, prior period, or prior year — whichever comparison you select. It weighs both the dollar variance and the percentage variance to decide what's actually worth flagging, so you're not reading a paragraph about a rounding-error line item next to one sentence about a category that moved 20%.
The tables render with the same green/red variance formatting your board already expects, and every explanation is grounded in your actual account-level data — it's not a generic template with your numbers dropped in.
Next: strategic commentary— the forward-looking section that turns this quarter's variances into next quarter's watchlist. Or see a live example at getnarrateai.com/demo.